
Home | Biodata | Biography | Photo Gallery | Publications | Tributes
Indus Script
|
|
Home | Biodata | Biography | Photo Gallery | Publications | Tributes Indus Script |
|
1. Introduction
One of the questions frequently asked about the Indus script is whether it represents any systematic writing at all. Even those who agree that the writings of the Harappan Civilization are not a haphazard arrangement of signs are at variance with one another regarding the language of the script1. Our purpose in the area of Harappan studies is to analyse the script in order to bring out the statistical structure2, of the texts.
To understand the semantic connection between words in modern languages, it is the practice3 to examine the habitual collocation of items and to investigate the level of gradation in collocability with reference to a given word.
In this paper, we make use of the tables of frequencies of pairs that Mahadevan has presented in his Concordance4 and examine whether the proximity between the signs forming a pair could be attributed to chance or not5. Mahadevan has studied seven terminal signs and interpreted them as ideograms6.
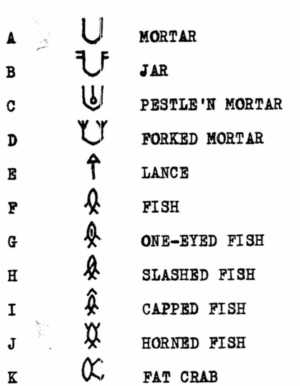
Here we are mainly interested in the jar (B) and the lance (E) signs (Table 1) and their association with the other signs. The choice of the jar is due to the fact that it is the most frequently occurring sign in the Indus texts. Another reason is that it has received more than its share of interpretations. It has been variously interpreted as representing Ur and as an affix or suffix and also as a determinative or case-ending7.
The lance is another terminal sign which seems to be functionally similar to the jar. We examine the pairs that each of these two signs form with sixty-five other common signs, which occur more than fifty times.
If a pair of signs occurs a large number of times, it is often concluded that there is some association or affinity between the two signs. In this paper, we go a step further and measure the extent of affinity. Our analysis is based on the fact that how large the frequency of a pair is, depends on how often each of the two signs occurs in pairs in that position. It enables one to develop an index, which measures the level of attraction or repulsion (or the lack of either) between two signs occurring next to each other.
2. Measurement of affinity and antiaffinity
Let us consider a specific example. Of the 9780 pairs listed in the concordance jar follows fish 44 times, 1332 pairs have jar on the left and 324 pairs have fish on the right. Hence we see that about 14% of all the pairs have jar on their left and consequently we would expect, in all the pairs with fish (F) on the right the sign on the left must be jar (B) 14% of times (i. e. 44 times), if there is no ground for attraction or repulsion between the two signs. The number obtained in this way under the hypothesis of chance is referred to as the theoretical frequency.
In this example we see that the observed frequency coincided with the theoretical frequency, leading to the conclusion that the occurrence of the pair
BF(jar+fish) is purely due to chance. Usually there will be a discrepancy between the two frequencies, which provides a measure of departure from the hypothesis of chance. On the basis of this discrepancy, we construct an index, whose value varies from
 100 to +100. The numerical value of the index specifies the confidence with which we reject the hypothesis of chance and the direction of the index indicates the hypothesis favoured by the empirical evidence. If the index is positive, it is favourable to the hypothesis of affinity and if it is negative, it goes in favour of the hypothesis of antiaffinity.
To consider another example, the pair BV(jar+ harrow) has an index value of 97. It means that there is a 97% chance that there is affinity between
jar and harrow signs. On the other hand, the pair BA (jar+mortar] has an index value
of 97. It follows that there is a 97% chance that there is
some sort of repulsion between the two signs forming the pair.
3. The jar sign
The jar(B), the lance(E) and the harrow (V) are some of the most common signs that occur in the terminal position of a text, either alone or with one or two terminal signs. An analysis like this should show that pairs made up of certain terminal signs should have a high value for the index of affinity. This happens with reference to certain pairs. For example,
BE, BV, BD where D is the
forked mortar, have values ranging from 97 to 100 for the index of affinity. On the other hand, we do not expect
B(jar) sign to occur together with initial signs. The index must show antiaffinity and that is exactly what happens in the following pairs, BP, BQ, and BR where P is the
diamond, Q is the double stroke and R is the wheel sign respectively. For the index, they have the value
100 each. Even though the first pair actually occurs eleven times, it is far too low compared to the expected frequency of 48, if their occurrence is purely due to chance.
One would expect the jar to have affinity with most of the signs occurring in the medial position. However the following pairs formed with the
fish signs, namely G, H, I and J where G, H, I and J are one-eyed
fish, slashed fish, capped fish, and horned fish respectively, show an
antiaffinity with the index ranging from 100 to 95. This is surprising. The following pairs also have high antiaffinity : FB, HB, IB and JB. However this can be explained in a different manner. Such pairs occur hardly two or three times
in the text. It is quite possible that the text ends (read from right to left) at the terminal sign namely the
jar sign, and a new text begins with the fish sign.
The following pairs have an affinity index of 100 : BK and BM, where K and M are the
fat crab and the open path signs respectively. These should be compared with the following pairs, which have a high index of antiaffinity : BL and
BN where L and N are the lean crab and the closed path respectively. This shows that even though the
fat crab and the lean crab as well as the open path and the
closed path signs look alike, they are not mutually interchangeable. The pair BB which occurs only once has an expected frequency of 56 and hence has an index
of 100 showing antiaffinity between members of the pair. Either the right sign occurs there by error or the same sign is used in a different sense.
4. The lance sign
As pointed out earlier, the lance sign (E) is also a frequently occurring terminal sign. It does not occur together at all with the jar(B) sign, which is another terminal sign. The pairs EB and BE have a negative value for index, showing that they have antiaffinity and in Mahadevan's Concordance they have only zero frequency. However the lance occurs together with the harrow(V) sign. The pairs EV and VE have an index of affinity of 100. With the common initial signs, it has antiaffinity as one would expect : EP, EC and ER.
This being a terminal sign, one would expect it to have affinity with most of the medial signs. In fact, the lance(E) has affinity with four of the fish signs. The following pairs have a high positive value for the index : EF, EH, EI and EJ. However, its occurring together with the fifth fish sign, namely capped fish, could be mainly due to chance. On the other hand, we wish to recall the fact that the jar sign did not have any affinity with the following fish signs : G, H, I and J. Therefore it is clear that the jar and the lance signs are not mutually interchangeable. Any one who tries to give values, phonetic or alphabetic, to the signs must be able to explain this and such differences, which are brought out by a study of this kind.
5. Right and left affinity
When two signs the jar(B) and the forked jar(D] occur together forming the pair BD, given that the right sign is D, what are the chances that the left sign is B ?. In other words, what is the left affinity of the forked jar with respect to the jar on its left ? The index of the left affinity is 97. That is, given that D is on the right, in 97% of cases, it will be followed by B. In contrast to this, the right affinity index of the jar is only 8. i. e. given that the jar has occurred, there is only 8% chance that it is preceded by the forked jar. Similarly, in the pair BV, the left affinity index of the harrow is 26, while the right affinity of the jar is only 1%. The following pairs have a high value for the affinity index discussed earlier : BS, BK, BT and BU, where S, K, T and U denote the deity, the fat crab, the crown and the hill signs respectively. In all the four pairs, the jar sign has a very low value for the right affinity index, which ranges from 1 to 7. All the signs on the right side have much large values for their left affinity towards the jar sign. These values range from 30 to 93. The left index values for the deity, the fat crab, the crown and hill signs are 93, 33, 51 and 30 respectively. Any one who interprets and gives values to the Indus signs will have to account for these and other findings.
6. Conclusion
In this paper, we have considered those pairs of signs which include either the jar or the lance signs. A paper dealing with the analysis of pairs containing a large set of signs will be presented elsewhere. We propose to computerize many of the calculations and extend the study from pairs to triplets of signs.
Acknowledgement
We wish to thank all our colleagues in the Department of Statistics, Madras Christian College, especially Mr. S.
Govindaraju and Mr. L. Doraipandian for their assistance during the preparation of the paper. We are grateful to the Department of Science and Technology for their financial support.
Notes :-
1. Iravatham Mahadevan, Dravidian Parallels in Proto-lndian script, Journal of Tamil
Studies, Vol. 2, No. 1, May 1970, pp. 157-275. S. R. Rao, The Decipherment of the Indus
Script, Asia Publishing House, Bombay, 1982. M. V. N. Krishna Rao, Indus Script Deciphered, Agam Kala Prakashan, New Delhi, 1982.
2. Gift Siromoney, Classification of frequently occurring inscriptions of Indus civilization in relation of metropolitan cities, STAT-45/80 (mimeo). Paper presented at the seventh annual Congress of the
Epigraphical Society of India, Calcutta, January 1981. Gift Siromoney and Abdul Huq, Cluster analysis of Indus signs
a computer approach,
Proceedings of the Fifth International Conference - Seminar of Tamil Studies, Madurai, 1981, Vol.1, pp. 2.15-2.23. Gift Siromoney and Abdul Huq, Segmentation of unusually long texts of Indus writings : a mathematical
approach,
Journal of the Epigraphical Society of India, Vol. 9, pp. 68-77.
3. G. L. M. Berry-Rogghe, The computation of collocations and their relevance to lexical studies,
The Computer and Literary Studies, A. J. Aiten et al, Ed., Edinburgh University Press, Edinburgh, 1973, pp. 103-112.
4. Iravatham Mahadevan, The Indus Script: Texts, Concordance and Tables, Memoirs of Archeological Survey of India,
New Delhi, 1977.
5. Abdul Huq, Mathematical Analysis of the Indus Script, M. Phil dissertation, Madras, 1983.
6. Iravatham Mahadevan, Terminal ideograms in the Indus Script, Harappan
Civilization, Gregory L. Possehl, Oxford and IBH Publishing Co., New Delhi, 1982, pp. 311-317.
7. John E. Mitchiner, Studies in the Indus Valley Inscriptions, Oxford and IBH Publishing Co., New Delhi, 1978.
| Roman Letter | Sign | Popular Description | Roman Letter | Sign | Popular Description |
|
 |
||||