
Home | Biodata | Biography | Photo Gallery | Publications | Tributes
Archaeology
|
|
Home | Biodata | Biography | Photo Gallery | Publications | Tributes Archaeology |
|
Introduction
About 2,00,000 years ago people of the Old Stone age (Lower Paleolithic Culture) fashioned rough stone implements out of quartzite and used them for hunting and skinning wild animals. These implements or artefacts are called ' the hand axes of Madras industry.' 1 The primitive men did not know the use of wooden handles for their stone axe-heads but used their hands instead. Several of such artefacts have been picked up in and around Madras including Tambaram.2 One of the authors has a small collection of stone age implements of Chingleput District.
These rough stone implements are said to belong to Paleolithic period. The next period called Mesolithic period, is placed around 8000 -- 2000 BC. The people of this period used microliths or very small tools of stone and these implements are found in the teris or fossil sand-dunes of Tirunelveli district. The next stage is known as the Neolithic or Polished Stone Age Culture and the period is fixed around 2500 -- 900 BC using carbon dating techniques. In this period man built houses for the first time, grew horse-gram and ragi, made fine pottery and used polished stone implements. These implements are made from closely grained basaltic rock which is found in the Shevaroy hills of Salem district. Polished Stone Axe can split, with ease and speed, a casuarina log over a foot in diameter and can be used to cut down an oak tree eight inches in diameter without injury to the blade.3
Upto 1960 the map showing the Neolithic sites of India4 had no marks of these artefacts on the western coast. One of the authors reported about two such polished stone axes, one found near the pre-historic burial site at Aadichanallur and another one from a place near the southern bank of Parnpa river in Kerala and these implements are pointed-butt axes.5
The Present Study
We have a small collection of these hand axes collected from two places in Chingleput district namely Arakonam and Sriperumpudur. From this collection we have carefully chosen fifty-nine artefacts, thirty-seven from Arakonam and twenty-two from Sriperumpudur for statistical analysis. These 59 implements are in fairly well preserved condition. (fig. 1)
Is it possible to find the type of tools used at these two places? Can we say that the implements found at Sriperumpudur are different in shape from those found at Arakonam? To answer these questions and to find any other fact about these implements, we have made computer analysis of these artefacts. Measurements were made on these stone axes and a technique known as k-means clustering was used to analyze these measurements.
Measurements
On each artefact, eight measurements, length and breadth measurements at seven different points are taken. These points are determined by dividing the length into eight equal parts and the breadth measurements are taken at these points. We have not made use of the thickness of the implements in this study.
Clustering Technique
The main objective of clustering a set of objects is to group objects that are similar in nature. It is usually expected that variations exist between clusters and objects within a cluster are homogeneous to a greater extent. In other words, objects within a cluster have greater degree of resemblance compared to objects belonging to different clusters.6
Cluster analysis is a commonly used technique to group artefacts. Guralnick of Chicago University has used this technique to analyze Greek sculptures.7, 8 Hodson has used this technique to analyze bronze brooches.9 Siromoney has used this analysis for Somaskanda panels of the Pallava period.10
There are several types of clustering techniques such as single linkage, average linkage, complete linkage and k-means available in the literature.11
We have analyzed the measurements of sculptures belonging to different periods of Tamil Nadu using various clustering techniques.12, 13 Of the techniques we have used for our analyses we have found that k-means method is a superior one. So it has been decided to use this technique to analyze the stone implements also.
As far as the stone implements are concerned they vary in size and shape. Clustering techniques, if properly used, can clearly indicate the presence of the size and the shape factors of the objects subjected to this analysis. First we examine whether there is any size factor present in the objects. Hence the analysis is carried out using all the eight measurements taken on each implement.
There are procedures available to determine the optimum number of natural clusters for a given set of objects. We have tried the number of clusters from two to seven. The optimum number of clusters is four for the actual measurements and these four clusters show fairly natural grouping. There is a uniform increase in size of the elements belonging to different clusters. The sizes of the elements or subjects of the first cluster are very small whereas the sizes of the elements in the last cluster are fairly large [Fig.3]. It clearly indicates that size plays a vital role in the different clusters when all the actual measurements are used.
In order to study the shape, it was decided to eliminate the size factor. This type of elimination of size factor has been used to study the shapes of carrots.14, 15
To make the objects independent of size, the measurements of each object are divided by the length of the object. These measurements are known as standardized measurements. We have analyzed these standardized measurements using k-means technique.
Using standardized measurements, we get five natural clusters. The objects belonging to the first cluster have the breadth narrower than their length. The objects that fall within the first cluster are elongated in shape. The breadth measurements of the objects in different clusters increase steadily from cluster one to cluster five [Fig.4.2]. The objects belonging to the fifth cluster are more or less round in shape.
The formation of clusters for actual measurements is given in Table 1. Table 2 provides the clusters for the standardized measurements. If the Paleolithic people lived in Arakonam and Sriperumpudur had used different shapes of tools, one would expect the implements from Arakonam and the implements from Sriperumpudur would be well separated in the clusters. Since no such separation is found in these clusters, we conclude that there is hardly any difference in shapes between the implements found at these two places.
Conclusion
Computer analysis of stone implements of Paleolithic period is rather new and we have tried it using a small number of implements available with us.
Analysis based on the actual measurements indicates that the size plays a dominant role in the determination of objects belonging to different clusters.
Analysis based on the standardized measurements shows that there are five different shapes of implements and there is no difference between the shapes of tools found at two different sites from Chingleput district.
These and other analyses can be carried out with a large set of objects, if available to us, using the computer facilities to explore a new dimension to these artefacts.
The computer programs written in Basic language were used to analyse the data in a computer installed at our department.
REFERENCES
1. Krishnaswamy, V.D. (1947), Stone Age India, Ancient India.
2. Siromoney, G, (l967}, Early history of the Tambaram area, Madras Christian College
Magazine, Vol. xxxvi, No. 2, pp. 47-49.
3. Sankalia, H.D, (1964), Stone Age Tools, Deccan College, Poona.
4. Krishnaswamy, V.D. (1960), Neolithic pattern of India, Ancient
India,
No. 16, pp, 25-64.
5. Siromoney, G. (1968), Polished stone axes: Two new records, Madras Christian
Magazine, Vol. xxxvii, No. 2. pp. 22-24.
6. Everitt, B.S. ( 1974), Cluster Analysis, Halstead Press,
London.
7. Hartigan, A. (1975), Clustering Algorithms, Wiley, New
York.
8. Guralnick, E.(1976), The proportions of some archaic Greek sculptured figures: A computer analysis,
Computer and the Humanities, Vol. 10, pp. 153-69.
9. Guralnick, E. (1978), The proportions of Kouroi, American Journal of
Archaeology, Vol. 82, pp. 461-472.
10. Hodson, F.R., Sneath, P.H.A. and Doran J.B. (1966), Some experiments in the numerical analysis of archaeological data,
Biometrika, Vol. pp. 311-324.
11. Lockwood,M., Siromoney, G. and Dayanandan, P., ( 1974), Mahabalipuram Studies, Christian Literature Society, Madras.
12. Bagavandas, M. (1982), Statistical Analysis of Measurements of South Indian
Sculptures, Ph.D. Thesis, University of Madras.
13. Govindaraju, S. ( 1982), Computer Analysis of Measurements of Pallava Sculptures
of South India, Ph.D. Thesis, University of Madras.
14. Snee, R.D. and Andrews, H.P. (1971), Statistical design and analysis of shape studies,
Journal of Royal Statistical Society, Series -- C, Vol. 20, No. 3, pp. 250-258.
15. Snee, R.D, (1972), A useful method for conducting shape studies, The Journal of Horticultural
Science, Vol. 47, No. 3, pp. 267-277.
| Arakonam | Sriperumbudur | |||
| No | % | No | % | |
| Cluster 1 | 12 | 54.5 | 10 | 45.5 |
| Cluster 2 | 15 | 60.0 | 10 | 40.0 |
| Cluster 3 | 8 | 80.0 | 2 | 20.0 |
| Cluster 4 | 2 | 100 | 0 | - |
Table 2 Formation of clusters using standardized measurements
| Arakonam | Sriperumbudur | |||
| no. | % | no. | % | |
| Cluster 1 | 9 | 59.2 | 8 | 47.1 |
| Cluster 2 | 14 | 70.0 | 6 | 30.0 |
| Cluster 3 | 11 | 73.6 | 3 | 21.4 |
| Cluster 4 | 3 | 50.0 | 3 | 50.0 |
| Cluster 5 | - | - | 2 | 100.0 |
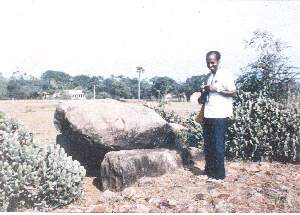
 Fig 1.Stone implements from Arakonam (top) and Sriperumpudur (bottom) |  Fig. 2. Stone implements arranged in five clusters using computer methods based on measurements. |

| 
| 
| 
| 
|

| 
| 
| 
|