Home | Biodata | Biography | Photo Gallery | Publications | Tributes
Indus Script
|
|
Home | Biodata | Biography | Photo Gallery | Publications | Tributes Indus Script |
|
The Indus Valley Civilization flourished over a vast region extending from West Punjab in Pakistan to East Punjab, Rajasthan, Uttar Pradesh and Gujarat for about a thousand years from 2500 B.C. to 1500 B.C. We do not know what kind of language it used, but it is certain that they knew the art of writing. In spite of many advances made in the science of deciphering codes, we do not know what to make of the writings of the Indus people. The decipherment of the Indus script is a great challenge to every Indian scientist.
Scholars in India and abroad have held differing view-points about the Indus writings. Some have questioned whether the signs represent writing at all. After careful study with the use of computers, a great many scholars have agreed that the signs represent writings in an ancient language and that the language was an early form of Dravidian. One should remember that the Indus people did not know the use of iron and the iron age came after the Indus culture. For several centuries following the Indus civilization, no writing existed in India.
The Brahmi script used by Asoka appeared all of a sudden as a fully developed script around 300 B.C. and it seems futile to trace the Brahmi script way back to the Indus signs.1 One of us proposed in 1977 that Brahmi script was invented at one stroke just prior to the period of Asoka and that many of the signs can be derived from certain compound symbols such as a cross superimposed on a square -- a symbol found in the Tamil cavern inscriptions of the pre-Christ era. T. N. Subramaniam2 has suggested that the Brahmi script was originally designed for Tamil and that it was later modified to write Prakrit. It is interesting that the theory of invention of Brahmi is discussed seriously by many scholars3 today against the theory of borrowing from a foreign script.
S. R. Rao, a senior archaeologist who excavated sites in Gujarat which yielded seals with the Indus signs has come up with another theory.4 He is of the view that the Indus signs stand for syllables, vowels and consonants and that the language is not Dravidian but Indo-European or a form of Sanskrit. He is able to recognize in the Indus writings certain names that are found in the Vedas. He is also of the view that there was evolution in the Indus system of writing from the complicated to the simple over a period of a thousand years.
Among foreign scholars who have worked on the Indus script there are prominent Russian and Finnish researchers5 who have tried to decipher the script with the aid of computers. Iravatham Mahadevan of the Indian Administrative Service has devoted many years to the study of the script. He has produced a valuable concordance of the Indus script.6 Type-setting for his book was done with the aid of a computer at the Tata Institute of Fundamental Research, Bombay. What the book establishes is that all the earlier claims of decipherment are unacceptable. It looks as though no claim of decipherment will be accepted by scholars unless a bilingual writing is found, i.e. if a portion is in a known script and another portion in Indus script, then the problem will be solved.
Yet the challenge of the Indus writings remains. Mr. Mahadevan has responded and has produced a valuable book but how shall we respond to this challenge of the century? In this paper we describe our response to this challenge.
Taking Mahadevan's book as a starting point, we have chosen the most common
signs that occur at least fifty times in the Indus writings. We have defined a
simple distance function between every pair of signs, based on the positions in
which the signs occur. Each sign may occur alone, may occur at the beginning of
a 'sentence', at the end of a sentence or in the middle. On the basis of
distance between every pair of signs, we have divided the set of 67 commonly
occurring signs into seven clusters using a technique called k-mean clustering.
The method can, briefly, be described as follows : Suppose the ith sign occurs Pi
l percentage of times alone and
Pi 2 and Pi 3 and Pi 4 percentage of times at the
initial, medial and final positions. The distance between the rth and sth signs
is defined by
d2rs = (pr1 - ps1)2
+ (pr2 - ps2)2 + (pr3 - ps3)2 +
(pr4 - ps4)2
We shall now describe the method used by the computer. The standard procedure
is to take, tentatively, the first k (say ten) signs as members of different
clusters. The
distance of the eleventh sign from each of these ten signs is calculated. This
sign
is clustered with whichever sign has the least distance from it. The other signs
can
be clustered in the same way. This process of reducing the number of clusters to
a
reasonable minimum has led to seven distinct clusters. We present here the different clusters and the signs in each cluster.
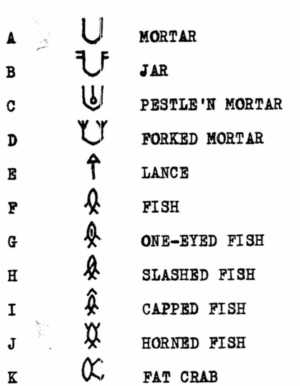
In this study we are not making any assumption about the nature of the signs. Each sign may represent an object on the one hand or just a character on the other. To make matters easier, we follow Mahadevan and take a sign to be single entity if it is entered so in his concordance.
Two signs are to be taken similar if they have very close positional characteristics. For example, some signs occur most often in the initial position, less often in the medial position but rarely in the final position. These will form a cluster and, will possibly belong to the same grammatical class. Some other signs may occur most often in the medial position, less often in the initial position and rarely in any other position. These will form another cluster representing possibly another grammatical class. Our distance measure is calculated on the basis of Mahadevan's table of positional distribution of signs.
A typical member of the first cluster occurs most often in the "medial position".Out of a hundred occurrences a typical sign occurs, on the average, 82 times in the medial position, 14 times in the initial position and 4 times in the final position. Many of the FISH signs belong to this cluster. Twenty-eight out of 67 common signs belong to this cluster.
The second cluster contains only three signs. One is a triangle and the other two resemble a bow and a wheel or the crescent moon and the sun. A typical member of this cluster occurs most often in the initial position (63%) and less often in the medial position (33%) and rarely in the final position (4%).
The third cluster has seventeen members. It is somewhat similar to the first cluster. A typical sign occurs more often in the medial position (56%) than in the initial position (40%). It rarely occurs alone (1%) or in the final position (3%).
The fourth cluster is quite different from the first three clusters. It contains the JAR and HARROW signs and also a sign that resembles the arrow. These are often identified as signs that stand for case-endings or suffixes and not nouns. The main characteristic of a typical sign in this cluster is that it occurs most often in the final position (79%), less often in the medial position (8%) and rarely alone (1%) or in the final position (2%).
The fifth cluster is similar to the second and contains three signs. One of the signs is like capital X with all the ends closed. Another sign similar to this but with open ends, is found in the first cluster. A typical sign in the fifth cluster occurs most often in the initial position (84%), less often in the medial position (14%) and rarely in the final position (2%).
The sixth cluster has four signs. A typical sign occurs fairly often in the medial (55%) and final (40%) positions and rarely alone (1 %), or in the initial position (4%).
The seventh cluster contains four signs. A typical sign of this cluster occurs in the medial (55 %), initial (23 %) and final (22 %) positions.
Thus we notice that there are four main groups. The first group contains first, third and seventh clusters. It is characterized by the most frequent occurrence of the signs in the medial and initial positions, in that order. The second group is made up of second and fifth clusters. Signs which occur most often in the initial position and less often in the medial position belong to this group. The third group has only one member : the fourth cluster. The characteristic of this group is the most frequent occurrence of the signs in the final and medial positions. The fourth group contains the sixth cluster. A typical sign in this group occurs most often in the medial position and less often in the final position. Of these the first group is the largest. It accounts for nearly three-fourths of the signs considered in this study (49 out of 67). The other groups contain 6, 8 and 4 signs respectively.
The Table shows the frequencies of occurrences of the signs in different positions, relative to their total frequency. The figures add up to 100 horizontally. The serial numbers correspond to the signs in the figure. What we have proposed here is a new line of investigation in the study of the Indus script.7 The clusters that we have formed are tentative and further work is necessary to sharpen the results keeping the clusters as they are. Other signs which are not common can tentatively be assigned to one of the seven clusters, on the basis of positional characteristics such as whether a given sign occurs most frequently in the final position or whether it occurs equally frequently in the final as well as medial positions. Further work is going on to divide the signs into clusters on the principle of mutual substitutability, i.e. two signs will be assumed to belong to the same grammatical class if they can be substituted for one another.
Cluster analytic methods have already been used successfully to divide a set of words in English in a given passage into a small number of clusters such that one cluster contains all articles, another propositions, and another verbs and so on.8 The same method has also been used to divide the letters of the alphabet into clusters of consonants and vowels. These methods use the principle of mutual substitutability to form clusters.
We wish to thank Mr. N. Siva Kumar, Mr. M. Chandrasekaran and Mr. R. Chandrasekaran for their assistance in writing a Fortran programme to form clusters and for running the programme in IBM 370 /155 computer at the Indian Institute of Technology, Madras.
REFERENCES
1. Gift Siromoney and M. Lockwood, 'The invention of the Brahmi Script'
Madras
Christian College Magazine, Vol. XLVI, 1977 and Souvenir of the Fourth Annual
Congress of the Epigraphical Society of India, Madras, 1978.
2. T. N. Subramaniam, 'South Indian Temple Inscriptions', Vol. Ill, Part II,
Government Oriental Manuscripts Library, Madras, 1957, pp. 1594.
3. S. P. Gupta and K. S. Ramachandran (Ed.), 'The origin of Brahmi Script', D.
K. Publications, Delhi, 1979.
4. S. R. Rao, 'The Indus people invent the alphabet', The Epigraphical Society of
India, Fifth Annual Conference Souvenir, February, 1979.
5. See the Journal of Tamil Studies, Vol. II No. 1, 1970.
6. Iravatham Mahadevan, 'The Indus Script: Text, Concordance and Tables',
Memoirs of the Archaeological Survey of India, No.77, Archaeological Survey of
India, New Delhi,
1977.
7. Gift Siromoney and Abdul Huq, 'The Indus Script : Challenge and Response',
Madras
Christian College Magazine. Vol. LXXIII, 1979. The present paper is an updated
version of this magazine report.
8. A. Rosenfeld, H. K. Huang and U. B. Schneider, 'An application of cluster
detection to text and picture processing', IEEE Transactions of Information
Theory, Vol. IT - 15, November, 1969.
 |
 |
 |
 |
 |
 |
Figure 1
Commonly occurring signs of the Indus script are grouped into seven
clusters.
Signs belonging to the same cluster would belong to the same
grammatical class.
Clusters are formed purely on the basis of positional
characteristics.
Relative frequencies (in percentages) of occurrence of signs in different positions
and their total frequencies
| Cluster Number | Serial Number | Concordance Number | Solo | (Relative frequencies in Percentage) | Total Frequencies | ||
| Initial | Medial | final | |||||
| I | 1 | 8 | 0.00 | 1.90 | 98.10 | 0.00 | 105 |
| 2 | 25 | 0.00 | 18.86 | 71.70 | 9.43 | 53 | |
| 3 | 51 | 0.95 | 23.81 | 71.43 | 3.81 | 105 | |
| 4 | 53 | 0.00 | 24.62 | 73.85 | 1.52 | 130 | |
| 5 | 59 | 4.72 | 9.45 | 81.10 | 4.72 | 381 | |
| 6 | 67 | 0.72 | 24.37 | 74.95 | 0.00 | 279 | |
| 7 | 70 | 0.00 | 23.29 | 75.34 | 1.37 | 73 | |
| 8 | 72 | 0.00 | 21.28 | 78.72 | 0.00 | 188 | |
| 9 | 97 | 0.00 | 1.10 | 95.60 | 3.30 | 91 | |
| 10 | 98 | 0.00 | 4.55 | 81.82 | 13.63 | 88 | |
| 11 | 99 | 0.00 | 0.31 | 96.30 | 3.39 | 649 | |
| 12 | 112 | 0.00 | 22.86 | 77.14 | 0.00 | 70 | |
| 13 | 121 | 0.00 | 15.71 | 82.86 | 1.43 | 70 | |
| 14 | 123 | 0.00 | 0.00 | 96.37 | 3.63 | 193 | |
| 15 | 124 | 0.00 | 24.36 | 75.64 | 0.00 | 78 | |
| 16 | 127 | 14.00 | 14.00 | 64.00 | 8.00 | 50 | |
| 17 | 130 | 0.00 | 0.00 | 92.06 | 7.94 | 63 | |
| 18 | 149 | 2.17 | 5.43 | 70.65 | 21.75 | 92 | |
| 19 | 194 | 0.00 | 5.17 | 91.38 | 3.45 | 58 | |
| 20 | 230 | 0.00 | 5.56 | 83.33 | 11.11 | 54 | |
| 21 | 249 | 0.59 | 20.59 | 75.29 | 3.53 | 170 | |
| 22 | 287 | 0.00 | 19.32 | 78.41 | 2.27 | 88 | |
| 23 | 294 | 0.00 | 7.55 | 92.45 | 0.00 | 53 | |
| 24 | 336 | 0.42 | 27.54 | 71.19 | 0.85 | 236 | |
| 25 | 341 | 0.00 | 18.64 | 76.27 | 5.09 | 59 | |
| 26 | 343 | 0.00 | 11.30 | 85.88 | 2.82 | 177 | |
| 27 | 347 | 0.00 | 0.85 | 98.30 | 0.85 | 118 | |
| 28 | 403 | 2.15 | 17.20 | 79.57 | 1.08 | 93 | |
| Average | 0.92 | 13.94 | 81.78 | 4.11 | - | ||
| II | 9 | 204 | 0.00 | 65.79 | 32.89 | 1.32 | 76 |
| 30 | 293 | 0.00 | 52.95 | 44.85 | 2.21 | 136 | |
| 31 | 391 | 1.54 | 69.22 | 21.03 | 8.21 | 195 | |
| Average | 0.51 | 62.65 | 32.92 | 3.91 | - | ||
|
III
|
32 | 17 | 0.00 | 41.75 | 53.85 | 4.40 | 91 |
| 33 | 28 | 0.00 | 34.00 | 56.00 | 10.00 | 50 | |
| 34 | 48 | 0.00 | 44.05 | 55.35 | 0.60 | 168 | |
| 35 | 65 | 0.46 | 35.65 | 63.43 | 0.46 | 216 | |
| 36 | 86 | 0.67 | 44.97 | 46.98 | 7.38 | 149 | |
| '37 | 87 | 0.27 | 40.27 | 54.53 | 4.93 | 365 | |
| 38 | 89 | 0.32 | 44.58 | 50.64 | 4.46 | 314 | |
| 39 | 102 | 4.64 | 47.01 | 46.36 | 1.99 | 151 | |
| 40 | 104 | 1.43 | 44.29 | 50.00 | 4.28 | 70 | |
| 41 | 171 | 0.00 | 28.03 | 69.70 | 2.27 | 132 | |
| 42 | 175 | 1.85 | 38.89 | 50.00 | 9.26 | 54 | |
| 43 | 197 | 1.67 | 36.66 | 60.00 | 1.67 | 60 | |
| 44 | 216 | 2.22 | 40.00 | 54.44 | 3.33 | 90 | |
| 45 | 244 | 0.00 | 29.21 | 70.79 | 0.00 | 89 | |
| 46 | 345 | 0.00 | 49.02 | 47.06 | 3.92 | 51 | |
| 47 | 387 | 0.00 | 29.41 | 70.59 | 0.00 | 102 | |
| 48 | 389 | 0.00 | 48.51 | 51.49 | 0.00 | 134 | |
| Average | 0.80 | 39.78 | 55.95 | 3.47 | - | ||
|
IV
|
49 | 1 | 2.24 | 8.96 | 24.63 | 64.18 | 134 |
| 50 | 12 | 1.25 | 1.25 | 11.25 | 86.25 | 80 | |
| 51 | 15 | 2.38 | 0.79 | 23.81 | 73.02 | 124 | |
| 52 | 176 | 0.49 | 0.00 | 10.70 | 89.01 | 355 | |
| 53 | 211 | 0.44 | 0.00 | 18.50 | 81.06 | 227 | |
| 54 | 251 | 0.00 | 4.11 | 12.33 | 83.56 | 73 | |
| 55 | 323 | 0.31 | 5.88 | 8.98 | 84.83 | 323 | |
| 56 | 342 | 0.22 | 0.07 | 30.11 | 69.60 | 1295 | |
| Average | 0.92 | 2.63 | 17.54 | 78.94 | - | ||
| V | 57 | 95 | 0.00 | 92.19 | 7.81 | 0.00 | 64 |
| 58 | 150 | 0.00 | 80.95 | 17.46 | 1.59 | 63 | |
| 59 | 267 | 0.27 | 79.26 | 16.49 | 3.99 | 376 | |
| Average | 0.09 | 34.13 | 13.92. | 1.86 | - | ||
| VI | 60 | 162 | 1.42 | 4.71 | 51.42 | 42.45 | 212 |
| 61 | 169 | 0.42 | 1.25 | 44.17 | 54.17 | 240 | |
| 62 | 252 | 0.00 | 3.92 | 64.71 | 31.37 | 51 | |
| 63 | 402 | 1.01 | 7.07 | 61.62 | 30.30 | 99 | |
| Average | 0.71 | 4.24 | 55.48 | 39.57 | 0 | - | |
| VII | 64 | 245 | 0.00 | 13.53 | 65.70 | 20.77 | 207 |
| 65 | 307 | 1.45 | 21.74 | 52.17 | 24.64 | 69 | |
| 66 | 373 | 0.00 | 31.15 | 47.54 | 21.31 | 61 | |
| 67 | 375 | 0.00 | 24.56 | 54.39 | 21.05 | 57 | |
| Average | 0.36 | 22.75 | 54.95 | 21.94 | - | ||